Introduction
I successfully performed metric data aggregation in RHQ using a Cassandra back end for the first time recently. Data roll up or aggregation is done by the data purge job which is a Quartz job that runs hourly. This job is also responsible for purging old metric data as well as data from others parts of the system. The data purge job invokes a number of different stateless session EJBs (SLSBs) that do all the heavy lifting. While there is a still a lot of work that lies ahead, this is a big first step forward that is ripe for discussion.Integration
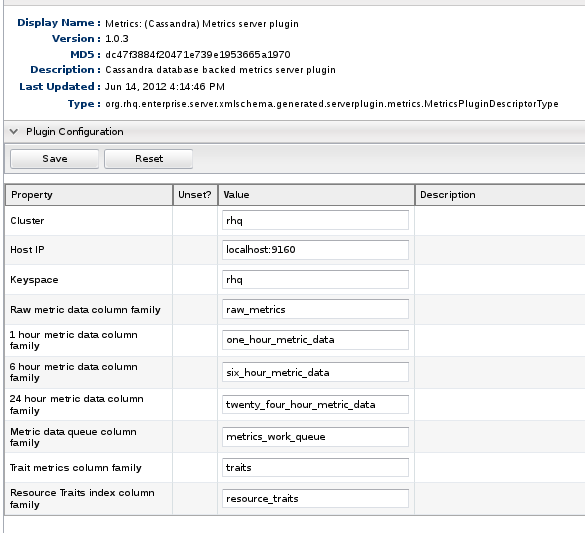
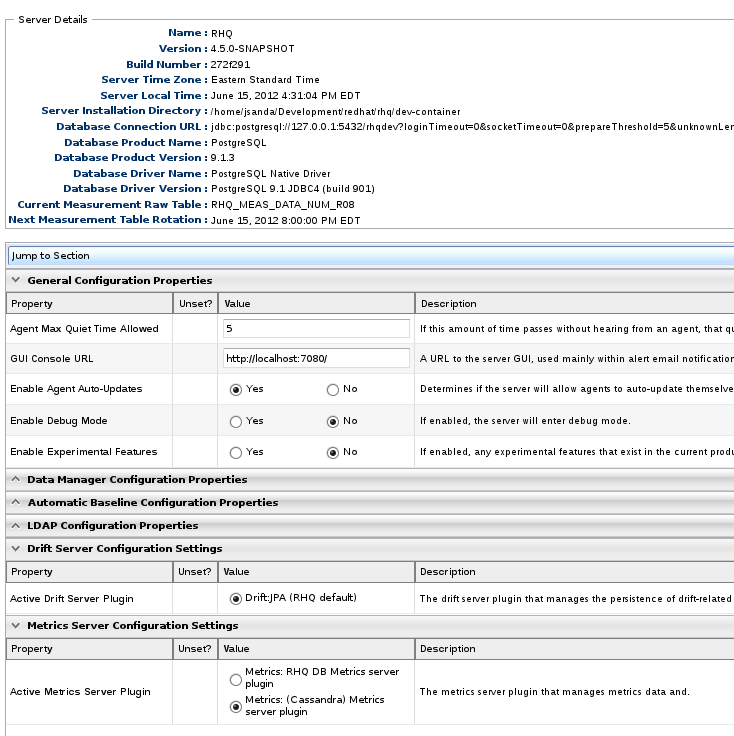
JPA and EJB are the predominant technologies used to implement and manage persistence and business logic. Those technologies however, are not really applicable to Cassandra. JPA is for relational databases and one of the central features of EJB is declarative, container-managed transactions. Cassandra is neither a relational nor a transactional data store. For the prototype, I am using server plugins to integrate Cassandra with RHQ.Server plugins are used in a number of areas in RHQ already. Pluggable alert notifcation senders is one of the best examples. A key feature of server plugins is the encapsulation made possible by the class loader isolation that is also present with agent plugins. So let's say that Hector, the Cassandra client library, requires a different version of a library that is already used by RHQ. I can safely use the version required by Hector in my plugin without compromising the RHQ server. In addition to the encapsulation, I can dynamically reload my plugin without having to restart the whole server. This can help speed up iterative development.
 |
| Cassandra Server Plugin Configuration |
 |
| System Settings |
Implementation
The Cassandra implementation thus far uses the same buckets and time slices as the existing implementation. The buckets and retention periods are as follows:| Metrics Data Bucket | Data Retention Period |
|---|---|
| raw data | 7 days |
| one hour data | 2 weeks |
| 6 hour data | 1 month |
| 1 day data | 1 year |
Unlike the existing implementation, purging old data is accomplished simply by setting the TTL (time to live) on each column. Cassandra takes care of purging expired columns. The schema is pretty straightforward. Here is the column family definition for raw data specified as a CLI script:
The row key is the metric schedule id. The column names are timestamps and column values are doubles. And here is the column family definition for one hour data:
As with the raw data, the schedule id is the row key. Unlike the raw data however, we use composite columns here. All the buckets with the exception of the raw data, store computed aggregates. RHQ calculates and stores the min, max, and average for each (numeric) metric schedule. The column name consists of a timestamp and an integer. The integer identifies whether the value is the max, min, or average. Here is some sample (Cassandra) CLI output for one hour data:
Each row in the output reads like a tuple. The first entry is the column name with a colon delimiter. The timestamp is listed first followed by the integer code to identify the aggregate type. Next is the column value, which is the value of the aggregate calculation. Then we have a timestamp. Every column has a timestamp in Cassandra has a timestamp. It is used for conflict resolution on writes. Lastly, we have the ttl. The schema for the remaining buckets is similar the one_hour_metric_data column family so I will not list them here.
The last implementation detail I want to discuss is querying. When the data purge job runs, it has to determine what data is ready to be aggregated. With the existing implementation that uses the RHQ database, queries are fast and efficient using indexes. The following column family definition serves as an index to make queries fast for the Cassandra implementation as well:
The row key is the metric data column family name, e.g., one_hour_metric_data. The column name is a composite that consists of a timestamp and a schedule id. Currently the column value is an integer that is always set to zero because only the column name is needed. At some point I will likely refactor the data type of the column value to something that occupies less space. Here is a brief explanation of how the index is used. Let's start with writes. Whenever data for a schedule is written into one bucket, we update the index for the next bucket. For example, suppose data for schedule id 123 is written into the raw_metrics column family at 09:15. We will write into the "one_hour_metric_data" row of the index with a column name of 09:00:123. The timestamp in which the write occurred is rounded down to the start of the time slice of the next bucket. Further suppose that additional data for schedule 123 is written into the raw_metrics column family at times 09:20, 09:25, and 09:30. Because each of those timestamps gets rounded down to 09:00 when writing to the index, we do not wind up with any additional columns for that schedule id. This means that the index will contain at most one column per schedule for a given time slice in each row.
Reads occur to determine what data if any needs to be aggregated. Each row is in the index is queried. After a column is read and the data for the corresponding schedule is aggregated into the next bucket, that column is then deleted. This index is a lot like a job queue. Reads in the existing implementation that use a relational database should be fast; however, there is still work that has to be done to determine what data if any needs to be aggregated when the data purge job runs. With the Cassandra implementation, the presence of a column in a row of the metrics_aggregates_index column family indicates that data for the corresponding schedule needs to be aggregated.
Testing
I have pretty good unit test coverage, but I have only done some preliminary integration testing. So far it has been limited to manual testing. This includes inspecting values in the database via the CLI or with CQL and setting break points to inspect values. As I look to automate the integration testing, I have been giving some thought to how metric data is pushed to the server. Relying on the agent to push data to the server is sub optimal for a couple reasons. First, the agent sends measurement reports to the server once a minute. I need better control of how frequently and when data is pushed to the server.The other issue with using the agent is that it gets difficult to simulate older metric data that has been reported over a specified duration, be it an hour, a day, or a week. Simulating older data is needed for testing that data is aggregated into 6 hour and 24 hour buckets and that data is purged at appropriate times.
RHQ's REST interface is a better fit for the integration testing I want to do. It already provides the ability to push metric data to the server. I may wind up extending the API, even if just for testing, to allow for kicking off the aggregation that runs during the data purge job. I can then use the REST API to query the server and verify that it returns the expected values.
Post a Comment